This material is marketing communication.
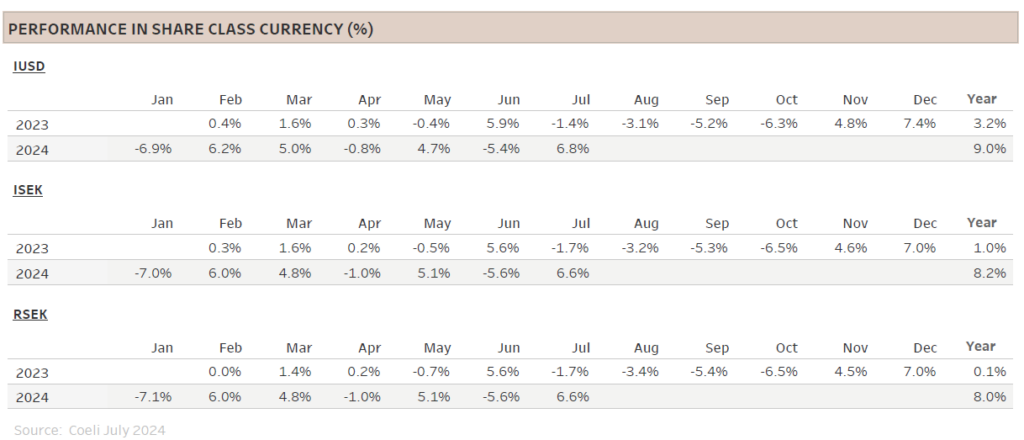
Note that the information below describes the share class (I USD), which is a share class reserved for institutional investors. Investments in other share classes generally have other conditions regarding, among other things, fees, which affects the share class return. The information below regarding returns therefore differs from the returns in other share classes.
Past performance is not a guarantee of future returns. The price of the investment may go up or down and an investor may not get back the amount originally invested.
1) Share Class I USD
Performance for other share classes towards the end of the report.
FUND MANAGER COMMENTARY
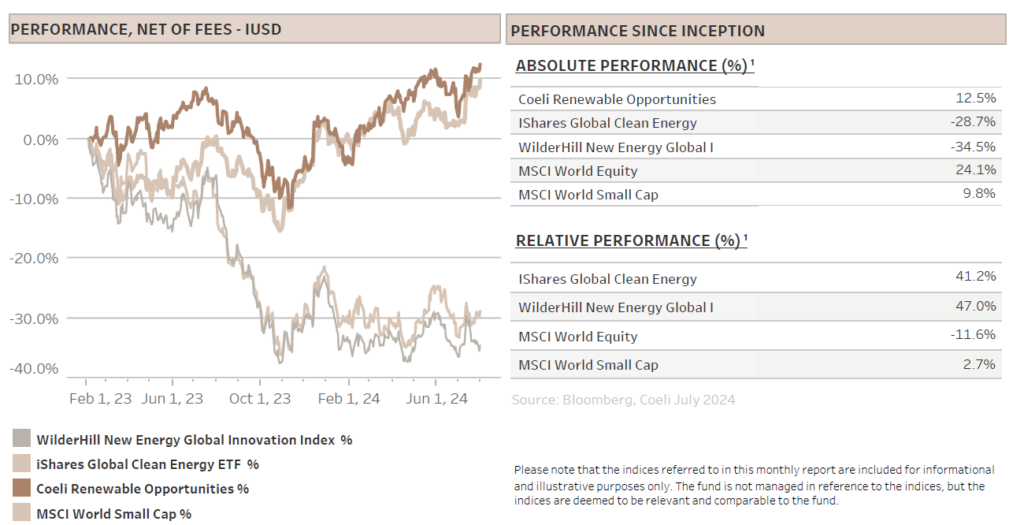
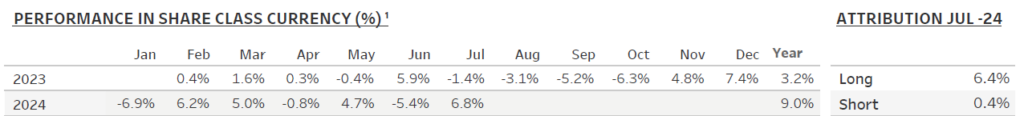
The Coeli Renewable Opportunities fund was up 6.8% net of fees and expenses in July (I USD share class). It has increased 9.0% this year and has gained 12.5% since the inception on February 6, 2023.
The fund grew its outperformance to the two most comparable indices, the Wilderhill New Energy Global index (NEX) and the iShares Global Clean Energy (ICLN), by 5.0% and 0.5%, respectively. The year-to-date outperformance is 23% and 18%, and since inception the fund is ahead by 47% and 41%, respectively.
The performance was strong on most measures in July. All but three themes were up, and despite the rally in small caps, the shorts also contributed positively, adding 0.4% to NAV while the longs contributed 6.4%. Active returns[1] during the month were 3.1% on the long side and 5.1% on the short side. Since inception, the fund has had positive active returns in 11 out of 18 months for the longs and a stellar 16 out of 18 months for the shorts.
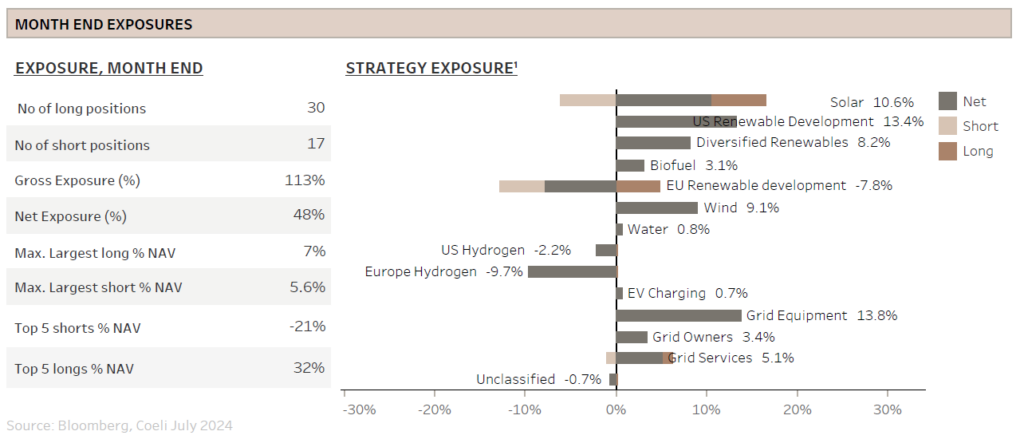
Net exposure was in the high 50% range and gross exposure averaged about 130% for most of July. However, risk was reduced into month-end and the net ended at 48% and gross at 113%.
MARKET COMMENT – ROTATION TO SMALL CAPS CONTINUED
The S&P 500 continued its melt up in July, rising by 1.1% and setting another six all-time highs for the year. However, as opposed to prior months, the driver was not the “magnificent seven” (Mag7) stocks, but rather the other 493 companies in the index. The S&P 500 equal weighted index (SPW) rose by 3.3%. Moreover, the rotation into small caps that started in April and May, but took a break in June, continued as Russel 2000 increased by as much as 10%.
The main driver was the increased confidence of rate cuts commencing in September, although Fed chair Powell was less explicit in his end-of-month remarks than many had anticipated. The market rotation was also supported by the slowing momentum in the Artificial Intelligence (AI) theme as more pundits are questioning the monetization of AI given the substantial capital investments by the hyperscalers. This concern was somewhat alleviated as at least Microsoft (MSFT) and META confirmed on their second quarter calls that the AI trade was still going strong.
The renewable indices underperformed other small-cap stocks in July despite reduced political risk in both France and the US. In France, the climate-change skeptic party did relatively poorly in the second round of the election and is unlikely to gain any significant political power in the coming years. In the US, President Biden stepped aside for Kamela Harris as the Democratic Party’s presidential candidate, and she is currently polling ahead of former president Trump in some key battleground states and is head-to-head in the betting market. This should give renewable energy equities a boost, especially since this also increases the odds of the Democrats winning at least the House. In a divided government outcome, it will be nearly impossible to revoke the Inflation Reduction Act (IRA).
While the stock market ended July on a high note pricing in a soft landing, August started with a big correction and recession concerns. The triggers were disappointing ISM figures and in particular very weak non-farm payroll data in the US. It did not help that NIKKEI fell 12.4%, its largest one-day drop since 1987, on hawkish comments from Bank of Japan (BOJ). FED cutting rates while BOJ is raising rates risks capital outflows from the most popular carry trade (USD/JPN), with potential significant impact on capital flows in other asset classes.
Despite the S&P 500 and Nasdaq tumbling 6% and 8% respectively during the first three days of August, both indices have regained about half of their losses at the time of writing. Better than expected economic activity numbers, dovish comments from the BOJ and stronger than anticipated second-quarter earnings have helped alleviate some of the market’s fear. Still, we note that the VIX (Volatility Index), which spiked to levels not seen since the financial crisis and peak covid, is trading at levels nearly twice its average level for the year. Additionally, while the bond market in early July was pricing in fewer than two Fed rate cuts for the year, it is now anticipating four cuts. Coupled with the rising uncertainty surrounding the U.S. elections, the stage is set for heightened volatility to persist into year-end.
CONTINUED MOMENTUM IN AI INVESTMENTS
Coming into the earnings season, all eyes were focused on the Mag 7 stocks. Investors were keen to see whether the substantial investments in AI data centres would begin to be reflected in their earnings or future guidance. If these investments did not translate into immediate financial gains, would the momentum behind AI investments stall or at least decelerate? For the power sector and many renewable energy companies, the anticipated surge in power demand driven by data centres has emerged as a significant growth driver. Any slowdown in AI investments would therefore pose a risk to the long-term prospects of these companies. We discussed this dynamic in detail in our March-24 report “ROADBLOCKS ON THE AI HIGHWAY”.
Alphabet was the first of the hyperscalers to report and despite its search revenues beating expectations and the claim that AI-related revenues had reached a scale of ‘billions of dollars’, the stock sold off and pulled down the rest of its peers and the market. Thankfully, Microsoft, Meta and Amazon later confirmed that not only did they see returns on the huge investments, but they also expect significant growth in spending on AI over the next years.
While Microsoft claimed that demand for AI was outgrowing supply and that it could not build data centres fast enough, Meta revealed that its upcoming Llama 4 AI model will require 10x the compute power versus the current Llama 3 model, warranting “significant” capex growth in 2025. From the renewable energy industry’s point of view, there is still momentum in the AI trade and demand for power is only going to increase.
We have discussed in several monthly reports how demand for powering data centres is likely to raise the price of renewable Power Purchase Agreements (PPAs). This was likely confirmed in July as we received an additional tangible data point signalling stress in the supply/demand balance of the power markets. At the end of the month, PJM, the largest Regional Transmission Organisation (RTO) in the US coordinating wholesale electricity in 13 states covering 65 million customers, announced that the clearing price in its capacity auction for 2025/26 delivery year had increased by a staggering 900% versus last year. As can be seen from the table below, the total cost in the auction jumped nearly sevenfold to USD 14.7bn from USD2.2bn in the prior period.
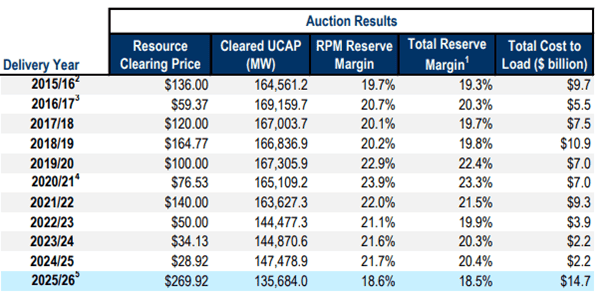
Source: PJM 2025/2026 Base Residual Auction Report – July 30
The capacity market auction serves to ensure there is sufficient load (power) to meet predicted energy demand in the future period with a margin called reserve margin. Historically, when reserve margins deteriorate, high capacity auction prices result in a surge in new power generation capacity investments. This is thus a good omen for both new renewable development and grid expansion.
Nevertheless, the high auction prices in PJM are only partly due to increased electricity demand from data centres and electrification of other industries. The high prices are also reflecting closure of mainly coal plants as well as new market rules to better account for extreme weather risk and adjustments to each power resource’s value in the auction. Either way, there is a supply/demand imbalance, and someone will have to pay for increasing the power generating capacity in the region.
In general, capacity payments are only a small part of the total bill for electricity customers in the US, e.g. it was only 8% of the total bill for customers last year, according to PJM. However, it is not difficult to predict a substantially higher share of capacity payments for PJM customers next year.
How will the consumers react to the higher electricity prices? On the one hand, the tech industry is creating a lot of new jobs through their large investments in the PJM states, but on the other hand, no one likes substantially higher utility bills. This is likely to continue to be a hot topic of discussion for some time and the blame game in the media is just starting. Thus far, the RTO has received most of the criticism by failing to plan for increased generation and grid upgrades. However, electricity bills are not yet reflecting the new capacity prices and we find it likely that finger pointing towards the tech industry could also become a topic.
This might have been one of the first tangible examples of the ensuing imbalance of supply and demand in the power markets, but more are sure to follow.
FUND PERFORMANCE – STRONG ABSOLUTE AND RELATIVE PERFORMANCE
We are pleased with July’s 6.8% absolute return and the increased relative outperformance to the two most comparable renewable energy indices, the NEX and ICLN. Although most themes were positive in July, there were no winners that stood out. Moreover, the only significant loser was ‘EU Hydrogen’ which deducted 0.7% from NAV as it only contains short positions. The ‘US Hydrogen’ theme, also only holding short positions, managed to contribute 0.4% to NAV despite the strong small cap rally.
The best performing theme was ‘Solar’, which added 1.6% to NAV, despite our largest long position, First Solar (FSLR), continuing to slide following the strong performance as part of the AI rally in May and June. Moreover, the company is one of the largest winners from the Inflation Reduction Act (IRA) and although we very much doubt the IRA will be revoked even in a red sweep scenario, we recognize that many investors might avoid the stock into the election. The other smaller positions we hold in utility scale solar also underperformed the solar index (TAN) which rose almost 5% in July. Instead, the solar theme’s performance came from sharp falls in a couple of long-held short positions that are closing in on bankruptcy, and from trading positions in residential solar stocks. The two largest residential companies, Sunrun (RUN) and Sunnova (NOVA), rose on improved clarity on tax credits for domestic content. They also benefitted from one of their largest peers filing for bankruptcy. Finally, due to the massive leverage in these business models, these stocks were among the largest losers as interest rates rose and should do well as interest rates start to fall - at least if the cuts are not due to a hard economic landing.
The second-best performing theme was ‘Wind’, contributing 1.1% to NAV. This theme consists of only long positions in the wind turbine and the wind carrier businesses. However, almost all the performance came from the largest position, Nordex (NDX1), which rose more than 20% on strong second quarter results with solid order intake and improving margins. The other turbine position, Vestas (VWS), continues to lag as order intake has been relatively weak in the first half of the year. We note though that orders are historically lumpy and due to the very strong fourth quarter last year, the average over the last four quarters is still solid. VWS is also strained by the perception of more political risk due to its strong market share in the US onshore and offshore wind markets. Former president Trump has claimed that he will stop all offshore wind developments and he is not known to be a fan of onshore wind either. However, it is the states, not the federal government, that contracts offshore wind farms and as long as federal permits have been granted during the Biden administration, they will be hard to revoke without significant costs to the federal government. A Trump administration might make it more difficult for future offshore wind projects, but as we have noted before, the record year for onshore wind installations in the US was in 2020, in Trump’s last year as president. Trump might hate wind turbines, but he seems to like cheap energy and US manufacturing jobs. Nevertheless, we acknowledge that the stock might be avoided by many investors until after the elections in November.
The third best performing theme was ‘Grid Equipment’ which added 1% to NAV. Main contributors were the cable manufacturers Nexans (NEX) and Prysmian (PRY), which increased by 16% and 9%, respectively, following NEX’s strong Q2 report. Although we continue to be firm believers in these companies’ competitive moat, we reduced the length of the theme into month end. As they contract out future capacity at fixed prices, the earnings upside becomes more limited versus the downside in estimates from capex and cost overruns. Moreover, while competition is limited in high voltage, there is new capacity being added to the market. In the medium-voltage segment, competition is increasing and within the low voltage segment, there is already fierce competition. In an eventual cyclical downturn, these two segments are most likely to suffer. We have also reduced exposure to NKT, the third large player in the high voltage cable market. It is still one of our largest positions though as it has the highest relative high voltage exposure and thus lowest risk if the economy should enter a recession.
Finally, it is also worth mentioning VOLUE, a grid software company listed on Oslo stock exchange offering different solutions for power producers to manage, automate and trade power assets. It was the second-best performing stock of the month after Nordex (NDX1) despite the position being only half the size of NDX1 before it jumped 45% on a take-over offer.
We invested in the stock early in the year but were not able to make it a sizeable position due to the company’s low market value and daily volume traded. However, while we are pleased to almost double our money in six months, we are not at all delighted by the terms of the offer from the Private Equity buyers. First, the offer is significantly undervaluing the company. Software companies with consensus three-year EPS CAGR of about 80% should trade on significantly more than 20 times earnings 3 year forward. If the stock would have been listed on a larger stock exchange with more experienced tech investors, we believe the price would have been a multiple higher. Secondly, we find the offer to be somewhat dirty as the largest shareholder, Arendals Fossekompani holding 60% of the shares, has negotiated a deal for itself where it is allowed to remain a 40% shareholder after the deal. We will obviously not vote in favour of the transaction, but with 67% of the shares pre-committed, we fear that the deal will go through.
Sincerely
Vidar Kalvoy & Joel Etzler
[1] Active returns are calculated based on % return on average allocated capital in the long and short leg, each measured against the average performance of iShares Global Clean Energy ETF and Wilderhill New Energy Index
Past performance is not a guarantee of future returns. The price of the investment may go up or down and an investor may not get back the amount originally invested.
- Portföljförvaltare och grundare av fonden Coeli Energy Opportunities.
- Mer än 15 års erfarenhet av investeringar från både publika och private equity-sidan.
- Förvaltade fonden Coeli Energy Transition under perioden 2019 - 2023.
- Spenderade sex år på Horizon Asset i London, en marknadsneutral hedgefond.
- Började arbeta tillsammans med Vidar Kalvoy 2012.
- Fem år inom Private Equity på Morgan Stanley.
- Startade sin investeringskarriär inom tekniksektorn på Sweden Robur i Stockholm 2006.
- Utbildad Civilingenjör från Kungliga Tekniska Högskolan.
- Portföljförvaltare och grundare av Coeli Energy Opportunities-fonden.
- Förvaltat aktier inom energisektorn sedan 2006 och har mer än 20 års erfarenhet från portföljförvaltning och aktieanalys.
- Förvaltade fonden Coeli Energy Transition under perioden 2019 - 2023.
- Ansvarig för energiinvesteringarna på Horizon Asset i London under 9 år, en marknadsneutral hedgefond.
- Erfarenhet från energiinvesteringar på MKM Longboat i London och aktieanalys inom teknologisektorn i Frankfurt och Oslo.
- MBA från IESE i Barcelona och Civilekonom från Norges Handelshögskola.
- Innan han började arbeta inom finans var han löjtnant i norska marinen.
IMPORTANT INFORMATION. This is a marketing communication.
Before making any final investment decisions, please refer to the prospectus of Coeli SICAV II, its Annual Report, and the KID of the relevant Sub-Fund. Relevant information documents are available in English at coeli.com. A summary of investor rights will be available at https://coeli.se/finansiell-och-legal-information/. Past performance is not a guarantee of future returns. The price of the investment may go up or down and an investor may not get back the amount originally invested. Please note that the management company of the fund may decide to terminate the arrangements made for the marketing of the fund in one or multiple jurisdictions in which there exists arrangements for marketing.