This material is marketing communication.
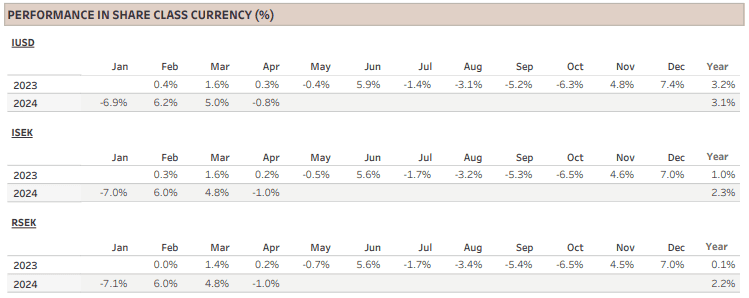
Note that the information below describes the share class (I USD), which is a share class reserved for institutional investors. Investments in other share classes generally have other conditions regarding, among other things, fees, which affects the share class return. The information below regarding returns therefore differs from the returns in other share classes.
Past performance is not a guarantee of future returns. The price of the investment may go up or down and an investor may not get back the amount originally invested.
1) Share Class I USD
Performance for other share classes towards the end of the report.
FUND MANAGER COMMENTARY
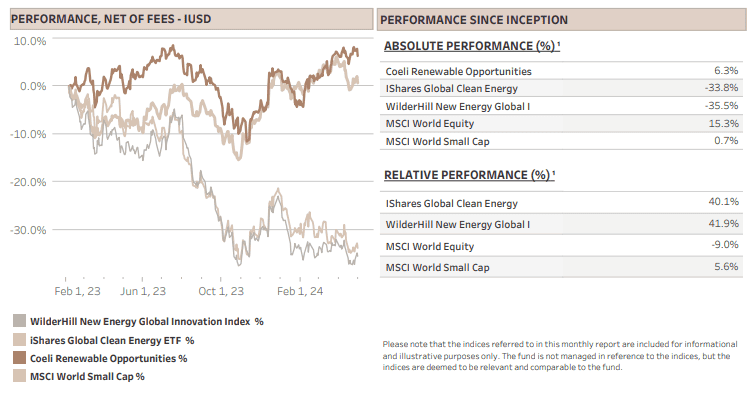
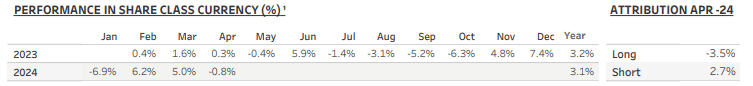
The Coeli Renewable Opportunities fund lost 0.8% net of fees and expenses in April (I USD share class). It is up 3.1% this year and has increased 6.3% since the inception on February 6, 2023.
In April, the fund outperformed the two most comparable indices, the Wilderhill New Energy Global index (NEX) and the iShares Global Clean Energy (ICLN), by 4.0% and 4.6%, respectively, taking the year-to-date outperformance to 18.5% and 18.1%. Since inception, the fund is ahead by 42% and 40%, respectively.
Performance in April was mixed. On the one hand, only a third of the themes made positive returns and long attribution was -3.5% while shorts made 2.7%. On the other hand, the relative performance was good and active returns were positive on both the long and the short side. Since inception the fund has achieved positive active returns 9 out of 15 months on the long side and 14 out of 15 months for the shorts. Beta adjusted alpha generation continues to be a solid 10% since inception.
The geographical mix of the returns was also unusual this month. Best performing theme by a large margin was “US Hydrogen” which only contains short positions and added 1.8% to NAV. However, “EU Hydrogen”, similarly a theme with only shorts, lost 1.1% of NAV. Interestingly, we saw the same dispersion between the “US Renewable development” theme, which was up 0.5% in April and the “EU Renewable development" theme which lost 0.9%. The latter can partly be explained by the more neutral positioning in EU developers versus only long positions in the US. However, the difference between the hydrogen themes is harder to explain. We dig deeper into hydrogen in this month’s report.
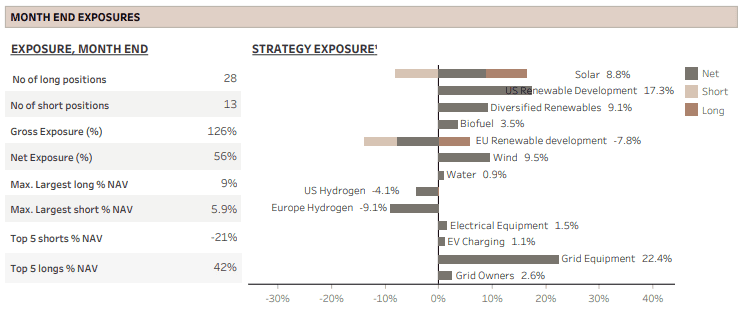
Nevertheless, it is very positive that dispersion within the broad renewable energy universe continues to improve, and we are seeing interesting trade opportunities on the both the long and the short side. The net exposure was in the low 50%s most of the month and ended at 56%, while the gross ended at 126%. We added a new theme called “Electrical Equipment” which is related to our much discussed “Grid” theme. As of next month, we will split the large “Grid” theme into several sub-themes.
MARKET COMMENT – CHAIRMAN POWELL TO THE RESCUE
After five consecutive months of gains and a 22% rally since the bottom in October, the S&P 500 experienced a 4.2% decline in April. This downturn was primarily driven by strong inflation figures and a weak first quarter GDP report at the month's end, sparking concerns about stagflation and pushing the 10-year Treasury yield to 4.7%. Consequently, the bond market scaled back its expectations for a FED rate cut in September to below 50%, anticipating only one full cut by year-end.
Fortunately, FED chairman Powell came to the market’s rescue once more. Early in May, he stated that he did not see the “stag” nor “flation” in the economic data. Additionally, he deemed it highly unlikely that the Fed's next move would involve a rate hike, effectively mitigating a significant potential risk in the market. Coupled with better-than-expected average Q1 earnings and upward revisions to the aggregate earnings estimates for 2024 and 2025, the market has largely rebounded from April's losses in the first two weeks of May.
RENEWABLE ENERGY - IS THERE HOPE ON THE HORIZON FOR HYDROGEN?
During the renewable energy bubble of 2020/21, hydrogen equities emerged as the market darlings, with sky high expectations for any company involved in or planning to produce or utilize green hydrogen. Today, those lofty expectations have been substantially tempered, and the stock market bubble has deflated with share prices reverting to pre-COVID levels.
Despite this market correction, political ambitions regarding green hydrogen remain largely unchanged. For instance, the EU continues to target production of 10m tons and import of additional 10m tons of green hydrogen annually by 2030. Similarly, the Biden administration, while less enthusiastic about facilitating imports, aims for 10m tons of production by 2030, 20m tons by 2040 and an ambitious 50m tons by 2050. Although many believe these targets are unrealistic, the incentives lined up by both the EU and the US in 2021/22 are now about to be made available.
We covered the US incentives in our monthly report from June 2023 - Will green hydrogen deliver on its promise of decarbonization? In this report, we will focus on Europe which delivered its first award from the EU Hydrogen Bank in late April. Despite the name, the Hydrogen Bank is not a physical institution but rather a financial instrument aiming to unlock private investments in hydrogen value chains by addressing the initial investment challenges.
In total, nearly EUR 720m was awarded to seven renewable energy projects, five in Iberia and two in the Nordics. The auction was 15 times oversubscribed (EUR ˜12bn) and attracted 132 proposals from 17 different countries. This indicates the high interest but also the fierce competition for funding. This is reflected in the winning bids of between EUR 0.37 and EUR 0.48 per kg of green hydrogen, which to put it in perspective is less than one tenth of the cost of production per kg. It was also well below EUs bid ceiling of EUR 4.5/kg. Without delving deeply into the specifics of the seven winning bids, it is safe to assume that the funding allocated is just one small component of the necessary subsidies needed to bring these projects to fruition.
The seven projects will have until the end of 2029 to commence production to receive the funding. Collectively they will supply a total volume of 1.58m tons of hydrogen over the span of ten years, which translates to only 1.6% of EUs ambitious 2030 goal for domestic production. Fortunately, there will be another EU Hydrogen Bank auction later this year which will be almost four times larger than the first. However, the terms are much less attractive, with a lower ceiling price, only 3 years to get operational and a 10% fine if not completed on time versus 4% in the first auction.
Still, assuming that most projects are rebid, we estimate in an optimistic scenario that the next auction could potentially generate an additional 3-4 million tons of hydrogen production over the course of 10 years. This would bring the EU approximately 3-4 percentage points closer to its 2030 target for domestic production. So, a bit closer, but still very far away.
Although there will probably be more auctions and the EU has a myriad of different subsidies schemes, given the considerable time required to construct large-scale hydrogen plants, we believe it is highly unlikely that the target of 10 million tons per year by 2030 will be met. This challenge is compounded by the fact that no such large-scale plant has been constructed yet, further underscoring the difficulty of meeting these ambitious production goals.
Unfortunately, the size of the target is not the most significant challenge. A critical concern is the scarcity of companies prepared to commit to long-term off-take agreements. Without these agreements, attracting investment for project development is almost impossible. So, what is deterring potential offtakers? Primarily, the cost competitiveness of green hydrogen remains highly uncertain. With the prevailing gas price in Europe, grey hydrogen can be produced for about EUR 2 per kg. Assuming optimistically that green hydrogen can be produced at large scale at EUR 5 per kg in 2030, subsidies or carbon taxes would have to bridge the difference. Second, infrastructure for storing and distributing green hydrogen does not exist and will have to be developed in parallel.
Third, the regulatory framework with regards to carbon pricing, certification standards and renewable energy incentives are still under development. Finally, the demand for green hydrogen as an energy carrier is still relatively limited and considering the improvements in battery technologies, green hydrogen’s competitive position is continuously weakening.
The uncertainties are massive and to put some numbers on the problem, if the EU should subsidise the EUR 3 per kg gap between green and grey hydrogen for both the 10m tons of domestic production and the 10m tons of imported hydrogen, it would incur an annual costs of EUR 60bn from 2030. While this expense would be distributed among member states, it is no small change compared to the total EU budget which stood at less than EUR 190bn in 2023.
However, there is potential for this cost to decrease considerably if renewable energy, which accounts for 65-80% of the total cost of green hydrogen, becomes more readily available at a lower cost. This was the expectation during the emergence of the hydrogen bubble in 2020, but it is now rather accepted that there may be a shortage of affordable clean energy in the coming years.
In addition, when optimistic hydrogen targets were set three to four years ago, little attention was paid to grid capacity and grid access. As highlighted in our March 2024 report – “Roadblocks on the AI highway”, grid capacity has emerged as one of the primary obstacles to the energy transition. Notably, connecting a 200MW green hydrogen plant to the grid ties up similar capacity and resources as a 200MW data centre. However, while the data centre owner can pay a premium for access due to its significant value creation, the hydrogen plant would require substantial subsidies.
The overarching objective of the energy transition is to decarbonise and replace fossil fuels with clean alternatives in the most economically viable manner. As emphasised in our June monthly report last year, unless there is an abundance of clean electricity, the inefficiency of using hydrogen as an energy carrier outweighs its benefits compared to direct electricity utilisation. Consequently, we maintain a sceptical stance on hydrogen’s role in the energy transition.
FUND PERFORMANCE – STRONG RELATIVE PERFORMANCE
In April, performance was mixed on an absolute level, but strong relative to the broad market and more importantly to the comparable renewable energy indices. Although only a third of the themes made a profit, we were pleased that there were no themes with considerable losses, indicative of good stock picking and solid risk management.
The top performing theme, contributing 1.8% to NAV, was “US Hydrogen” which consists of only short positions. Although much of the hype around hydrogen has dissipated, we believe that most stocks in this space are still overvalued. As described above, subsidising hydrogen on a large scale at current costs is economically unfeasible. Order intake will likely continue to disappoint, leading to downward revisions in sell-side estimates. Over time, most will burn through the cash they raised during the hype phase.
The situation is similar in Europe, although our “EU Hydrogen” theme, which also comprises solely short positions, was among the worst performers, losing 1.1% in April. Maybe the stocks got a boost from the first EU Hydrogen Bank auction which makes it more likely that the seven winning projects will reach Financial Investment Decision (FID) by the end of the year. Additionally, European small caps may have benefited from expectations of reduced base rates in June, contrasting with the ever delayed rate cuts in the US. Nevertheless, we believe the main reason for the strong performance is rather crowding on the short side. Elevated short interest and borrowing cost prompted us to reduce our net short position during the month.
The second-best performing theme, “US Renewable Development” added 0.5% to NAV. We discussed this theme in detail in the last monthly report, but the short version is that the two long positions, the renewable developers Nextera Energy (NEE) and AES are very well positioned to capitalize on the investment surge in large-scale data centres. Conversely, the European counterpart, “EU Renewable Development” lost 0.9% of NAV during April. This theme is skewed net short, serving partly as a hedge against the net long positions in US developers and the purely net long “Grid Owners” theme, which comprises network operators EON (EOAN) and Elia (ELI). In addition, we are more optimistic to the data centre boom in the US vs Europe, at least initially. Finally, we anticipate that European power prices will be negatively impacted by the upcoming wave of LNG supply hitting global markets towards the end of 2025 and into 2026. While this could be offset by higher carbon prices, we expect the market to increasingly focus on this issue into the next winter.
The worst performing theme of the month was “Diversified renewables” which deducted 1.3% from NAV. This theme, as frequently highlighted in previous monthly reports, comprises solely our largest position, Chart Industries (GTLS). The stock ended March month on a multi-month high, up 49% since the bottom in January, but lost 13% during April on no company specific news. However, the company’s Q1 report in early May was well received and the stock has recovered most of the drawdown from March. We continue to believe that the stock will be valued at a significantly higher multiple when it has deleveraged its balance sheet.
Finally, the “Grid” theme, boasting the largest gross exposure, recorded a modest gain for the month. As this theme only contains long positions, we are pleased with its relative performance to both renewable and the broad market indices. While first-quarter earnings reports in April and May have been mixed, any selloffs stemming from misses have so far been bought. This suggests investor confidence in the long-term investment thesis. Beginning in May, we have subdivided the theme into “Grid Equipment” and “Grid Services” alongside related themes “Grid Owners” and “Electrical Equipment”. We continue to add positions to this large secular theme.
Sincerely
Vidar Kalvoy & Joel Etzler
Past performance is not a guarantee of future returns. The price of the investment may go up or down and an investor may not get back the amount originally invested.
- Portföljförvaltare och grundare av fonden Coeli Energy Opportunities.
- Mer än 15 års erfarenhet av investeringar från både publika och private equity-sidan.
- Förvaltade fonden Coeli Energy Transition under perioden 2019 - 2023.
- Spenderade sex år på Horizon Asset i London, en marknadsneutral hedgefond.
- Började arbeta tillsammans med Vidar Kalvoy 2012.
- Fem år inom Private Equity på Morgan Stanley.
- Startade sin investeringskarriär inom tekniksektorn på Sweden Robur i Stockholm 2006.
- Utbildad Civilingenjör från Kungliga Tekniska Högskolan.
- Portföljförvaltare och grundare av Coeli Energy Opportunities-fonden.
- Förvaltat aktier inom energisektorn sedan 2006 och har mer än 20 års erfarenhet från portföljförvaltning och aktieanalys.
- Förvaltade fonden Coeli Energy Transition under perioden 2019 - 2023.
- Ansvarig för energiinvesteringarna på Horizon Asset i London under 9 år, en marknadsneutral hedgefond.
- Erfarenhet från energiinvesteringar på MKM Longboat i London och aktieanalys inom teknologisektorn i Frankfurt och Oslo.
- MBA från IESE i Barcelona och Civilekonom från Norges Handelshögskola.
- Innan han började arbeta inom finans var han löjtnant i norska marinen.
IMPORTANT INFORMATION. This is a marketing communication.
Before making any final investment decisions, please refer to the prospectus of Coeli SICAV II, its Annual Report, and the KID of the relevant Sub-Fund. Relevant information documents are available in English at coeli.com. A summary of investor rights will be available at https://coeli.se/finansiell-och-legal-information/. Past performance is not a guarantee of future returns. The price of the investment may go up or down and an investor may not get back the amount originally invested. Please note that the management company of the fund may decide to terminate the arrangements made for the marketing of the fund in one or multiple jurisdictions in which there exists arrangements for marketing.