This material is marketing communication.
Note that the information below describes the share class (I USD), which is a share class reserved for institutional investors. Investments in other share classes generally have other conditions regarding, among other things, fees, which affects the share class return. The information below regarding returns therefore differs from the returns in other share classes.
Past performance is not a guarantee of future returns. The price of the investment may go up or down and an investor may not get back the amount originally invested.
1) Share Class I USD
Performance for other share classes towards the end of the report.
FUND MANAGER COMMENTARY
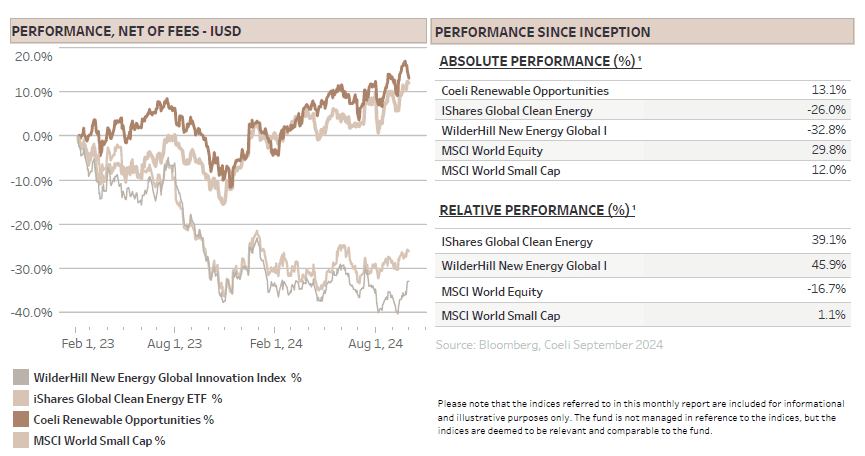
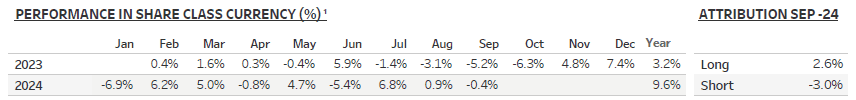
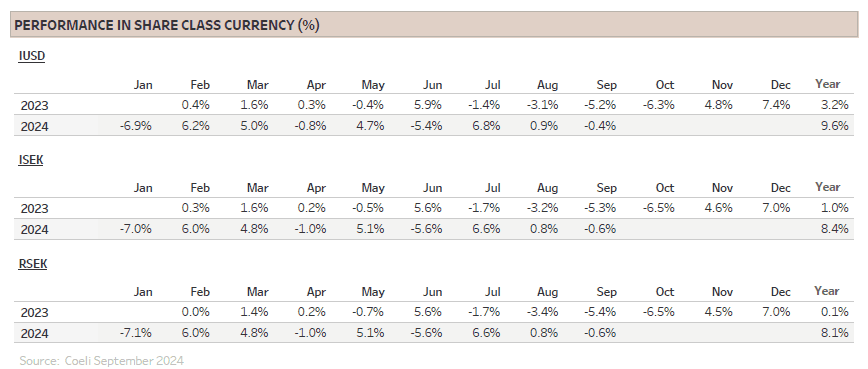
The Coeli Renewable Opportunities fund lost 0.4% net of fees and expenses in September (I USD share class). It is up 9.6% year to date and has increased by 13.1% since the inception in February 2023.
In September, the fund underperformed the most comparable indices, the Wilderhill New Energy Global index (NEX) and the iShares Global Clean Energy (ICLN) by 5.3% and 3.2% respectively. However, the year-to-date outperformance is still solid at 22% and 15%, and the fund is ahead by 46% and 39% respectively since the inception in February last year.
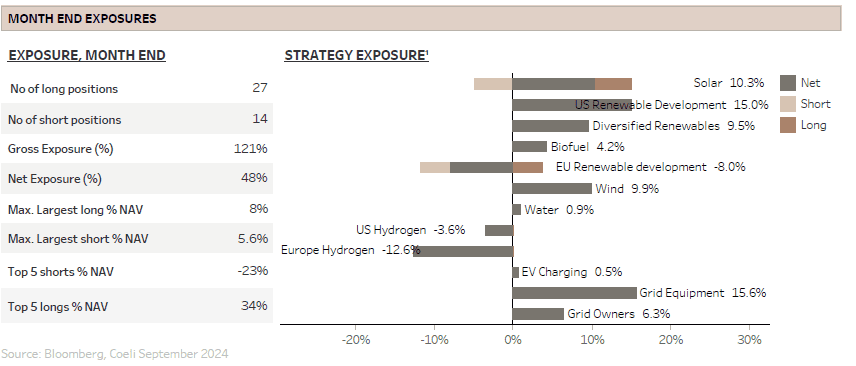
The intra month volatility was unusually high during September. The fund drew down more than 3% of NAV in the first week of the month as the market again panicked about a hard economic landing. As the recession fear receded, the fund gained more than 7% before a short squeeze in hydrogen shorts resulted in an almost flat monthly performance. The worst performing theme was “EU Hydrogen” which lost 1.9% of NAV, while best performer, adding 1.6% to NAV, was “US Renewable Development” which continues to benefit from expectations of lower interest rates and higher power demand. Long attribution was 2.6% while shorts lost 3.0% in September.
As we discussed in the previous monthly, we see binary risk in the renewable energy space into the US election in November, and we reduced the net exposure from high 50% to 47% at month end. We have over the last months also skewed our exposure more to Europe to diversify and in anticipation of reduced uncertainty post the US election. Gross exposure was in the 110-120% range most of the month and ended at 119%.
MARKET COMMENT – REASSURING MESSAGE FROM THE FED
September started off much like August, with a significant market selloff in the first week as weak macroeconomic data once again fuelled fears of a hard landing. The S&P 500 pulled back as much as 4.5%, its largest weekly loss this year. However, as the recession risk receded, the index recovered ahead of the FED meeting mid-month. While most macro analysts anticipated a 25bps rate cut and were concerned that a 50bps cut would signal dire economic conditions, the bond market was evenly split on the likelihood of a larger cut. It was the first time in several decades that there was this much uncertainty around the size of a FED cut.
However, as the Fed cut rates by 50bps and Chairman Powell delivered a reassuring message about the prospects of a soft landing, the S&P 500 index set another five new all-time highs and rose 2% during the month. It is up 21% YTD and has set new all-time highs on more than 20% of the trading days this year. While Nasdaq rose by 2.5%, the Russel 2000, the small cap index, only increased by 0.5%. Notably, renewable energy indices outperformed, climbing around 4% on average, potentially a sign of what is to come as the bond market price a soft-landing scenario and the US presidential election remains too close to call.
At the end of the month, the bond market was expecting almost three 25bps cuts across the final two FED meetings of the year, and in total 200bps more cuts by the end of 2025. The fight against inflation had seemingly been won but the fear of a recession was very much present. However, at the time of writing, post very strong labour data in early October, the bond market is down to only two 25bps cuts this year and only 150bps aggregate cut by the end of next year. It is remarkable how quickly the market can shift from fears of a hard landing to concerns about no landing at all, sometimes within just a few weeks and driven by only a handful of data points. Suddenly, inflation data is back in the spotlight, carrying significant weight again.
While fewer rate cuts may negatively impact rate-sensitive renewable energy stocks, we prefer this scenario over the growing risk of a recession. Unfortunately, political risk remains elevated, and until the election is behind us, we will continue to take a cautious approach in our positioning.
IS THE ASSET MANAGEMENT INDUSTRY USING THE RIGHT METRICS TO MEASURE A COMPANY´S CLIMATE IMPACT?
We would argue no, not even close. So, if we are using the wrong metrics, how come climate investments are so high on the agenda for sustainable funds and why are so many subscribing to being net zero by 2050?
The conventional wisdom is to measure companies’ Scope 1-3 emissions and to invest in those with low emissions or a credible plan to reduce them. In many cases, Scope 3 emissions are the largest and most relevant, yet because they are difficult to measure, they are often excluded from calculations.
Is there any point to even consider emissions if you cannot accurately measure scope 1, 2 and 3 emissions? Yes and no. One the one hand, mathematically it makes no sense. It is like judging the performance of a fund that only reports profitable trades or only trades in one of its regions. Aggregating this at a portfolio level makes even less sense since one company’s Scope 2 emissions are another’s Scope 1, the risk of double counting is significant. We are now at a mathematical sanity level close to measuring only the positive trades in the US for a global equity fund, essentially meaningless.
On the other hand, investors’ focus on emissions influences companies to attempt measuring them, which is after all a pre-requisite to actually reducing their footprint. Moreover, data is constantly improving and with time, these metrics should become more useful.
Nevertheless, let us not lose sight over what is the purpose of the reporting. No, it is not to line the pockets of ESG consultants, though it sometimes feels that way. The real goal is, or should be, to channel capital toward companies that are actively contributing to a greener world and leading us toward net zero.
So, which companies are providing the products and services that will get us to net zero? Renewable energy companies are the clearest example. Their products may generate emissions upfront, but over time, they lead to substantially lower overall emissions. Renewable energy is one of the few viable solutions for the world to reduce total emissions.
However, renewable energy companies, for instance those involved in solar, wind, batteries, hydro power and even nuclear, have relatively high emissions during construction and consequently generally score worse on Scope 1-3 than companies with business models that does not involve power generation. Given that about three-quarters of all global emissions stem from human’s use of energy, it is perplexing that clean energy is given a worse emission score than companies selling for instance software or banking services. The current measure simply does not give credit for the avoided emissions. This is where Scope 4 comes in—a metric that could make emission reporting far more useful by recognizing the avoided emissions and the real contribution companies make toward a low-carbon future. We discussed the background of the work we have done on Scope 4 in our February 2024 monthly report “HOW CAN YOU TELL IF A FUND IS GREEN?”
We also described that there are different classifications of funds with article 9 funds being the most sustainable, according to the Sustainable Finance Disclosure Regulation (SFDR). To be an article 9 fund, the investments shall be sustainable first and performance focused second.
It is therefore noteworthy that two of the most well owned companies by article 9 funds are two of the world’s largest companies, Nvidia and Microsoft, both have around 200 article 9 funds on the list of shareholders, according to Bloomberg.
Let us take a closer look at Microsoft. Despite its gigantic size, not only does it have the resources to be able to report ESG in a very detailed manner, but it also has very ambitious climate goals. In fact, in 2020 it released its moonshot plan of net zero by 2030, which means that by 2023 it should have reduced emissions by 30%. Instead, it has increased emissions by as much as 30% so far.
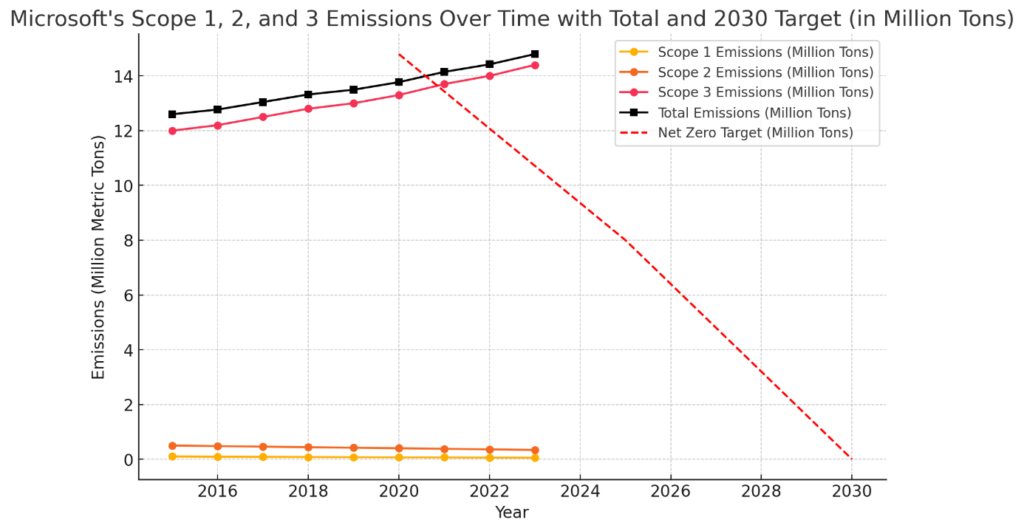
Microsoft 2024 sustainability report, ChatGPT
To be fair, the short fall is not due to Microsoft’s lack of effort and capital invested in decarbonisation, it is rather a consequence of accelerated build out of power-hungry and very profitable AI Datacentres. Clearly, Microsoft, with a fiduciary duty to its shareholders, has prioritized profit over climate, but how does that square with the goal of article 9 funds to be sustainable first and performance focused second?
We believe it is evident that new and improved systems of measurement are required for the investment management industry to be able to claim to do “green” investments that can be confirmed by objective metrics.
To that end, as described in our February 24 report, we have collaborated with researchers at Linköpings University in Sweden to develop a method to calculate and allocate Scope 4 emission across the value chain. Although initially focused on solar and wind applications, the method can also be applied to adjacent and important sectors like power grids. We believe this is crucial in understanding what investments really make a difference for the climate.
We encourage you to take a look at the report:
https://liu.diva-portal.org/smash/record.jsf?pid=diva2%3A1880366&dswid=-4215
A key aspect of the research pertains to the Life Cycle Analysis (LCA) and the allocation of the emissions between different products. This allows the benefit of avoided emissions to not only be attributed to the wind turbine or solar panel manufacturer but to be shared with equally critical products and services like grid power lines, transformers or wind installation vessels. The LCA allocates the avoided emissions based on the physical relationship between the products or as can be seen in the report, the monetary value the products bring to the process.
Currently the electrical grid for instance, a key enabler of electrification, would without a robust LCA not get credit for the emissions it helps to avoid. As an example, the fund owns electricity distributor EON (EOAN), which has relatively high Scope 1-3 emissions and its activities are only 19% EU taxonomy-aligned according to its latest filing. It does not screen as a particularly sustainable investment. However, the company will be investing EUR 34bn over the next 3-4 years in the power grid, coincidentally the same as its market value. Without these investments, it would be difficult to add new renewables to grid and the electricity generated by new solar and wind plants would not reach Microsoft’s new data centres.
The work on Scope 4 is unfinished and needs to continue with further refinement. We believe it is a good start as it is focused on the two fastest growing energy sources globally. This makes it instantly useful, and we do hope that this work will lead to further research and development in this field. Asset managers are in dire need of more useful data that incentivises the allocation of resources to companies that help the world reduce emissions, not just grow them at a slower rate.
If you are interested in more information, please reach out.
FUND PERFORMANCE – SHORT SQUEEZE IN HYDROGEN
September was a difficult month for the fund with 7 out of 13 themes with negative returns and a total decline in NAV of 0.4%.
We were surprised by the big sell off in the first week of the month and hesitated to reposition for the surprisingly positive outcome of the FED meeting mid-month. Moreover, although the fund has no direct exposure to Chinese equities, the record-breaking rally in China into month end following coordinated fiscal and monetary stimulus impacted some of our solar shorts with subsidiaries in China.
The worst performing theme in September was “EU Hydrogen” as some, but not all our European shorts squeezed in the last week of the month. The squeeze was partly triggered by lower-than-expected losses, guidance of lower costs going forward or announcement of orders, but the risk-on sentiment caused by the squeeze in China also helped these stocks. Although lower costs and smaller losses are undoubtedly positive for the individual companies, we note that revenue estimates going forward are hardly changed. For these companies to justify their lofty valuations, cost cutting is not enough, there need to be significant revenue growth as well.
As we have discussed in many previous monthly reports, we doubt there will be a massive build out of green hydrogen production and infrastructure. Even in cases with large capex subsidies, the green hydrogen economics are not strong enough to find off takers willing to guarantee demand of significant volumes for years to come. Although increased carbon taxes could make it less unappealing, we believe the only viable solution would be substantial, sustained subsidies to drive demand. However, we believe the current political environment is not conducive to increased subsidies, and we remain firmly negative to the space. We took the opportunity to add a new short to this theme.
The second worst performing theme was “Solar” which detracted 1.1% from NAV. Although the residential solar long positions pulled back somewhat after increasing 100-200% from the bottom in April, the primary drag on returns was a short in a US listed solar panel producer with subsidiaries listed in China and Hong Kong. We remain uncertain about how the Chinese stimulus measures will impact the solar panel industry. On the one hand, increased fiscal stimulus should boost demand for everything including solar installations. On the other hand, the solar panel industry is massively oversupplied and desperately in need of consolidation to reduce the number of manufacturers. Lower interest rates and easier access to bank financing combined with slightly higher demand could give these companies an undeserved lifeline, potentially prolonging the industry's woes.
More important for our solar shorts with links to China is what happens with tariffs and access to subsidies in the US. Former president Trump is threatening with increasing tariffs on China if he wins the presidency. Moreover, some republicans in Congress are arguing that no company with Chinese ownership manufacturing in the US should be eligible for tax credits from the Inflation Reduction Act (IRA). To make it worse, many Democrats agree with their Republican colleagues. This means whatever the outcome of the election, the uncertainty around these companies and their eligibility for subsidies will be extensive. As the election approaches, we continue to see these stocks as attractive shorts.
On a brighter note, the best-performing theme in September was "US Renewable Development," which added 1.6% to NAV. We have discussed this theme many times and it still only contains two long position, Nextera Energy (NEE) and AES, two of the leading renewable developers in the US. Both are very well positioned to capitalize on the AI-driven surge in power demand. The hyperscalers prefer to work with established developers as the value of time-to-power makes any delays very expensive. The two companies also benefit from lower interest rates and as utilities, the stocks will have much less downside than the rest of the renewable universe if the rate cuts should come with a recession. Both stocks are among our top five positions.
The second-best performing theme was again “Grid Equipment”, which mainly consists of the three large European cable layers Prysmian (PRY), Nexans (NEX) and NKT. While this theme added just 0.6% to NAV in September, it remains the best performer for the year. The demand for grid equipment is one of the largest bottlenecks in scaling power capacity for AI and broader electrification efforts. While the undersupply of grid infrastructure will ease over time, we anticipate several more years of strong revenue growth and improving margins in this sector.
Sincerely
Vidar Kalvoy & Joel Etzler
Past performance is not a guarantee of future returns. The price of the investment may go up or down and an investor may not get back the amount originally invested.

- Portföljförvaltare och grundare av fonden Coeli Energy Opportunities.
- Mer än 15 års erfarenhet av investeringar från både publika och private equity-sidan.
- Förvaltade fonden Coeli Energy Transition under perioden 2019 - 2023.
- Spenderade sex år på Horizon Asset i London, en marknadsneutral hedgefond.
- Började arbeta tillsammans med Vidar Kalvoy 2012.
- Fem år inom Private Equity på Morgan Stanley.
- Startade sin investeringskarriär inom tekniksektorn på Sweden Robur i Stockholm 2006.
- Utbildad Civilingenjör från Kungliga Tekniska Högskolan.
- Portföljförvaltare och grundare av Coeli Energy Opportunities-fonden.
- Förvaltat aktier inom energisektorn sedan 2006 och har mer än 20 års erfarenhet från portföljförvaltning och aktieanalys.
- Förvaltade fonden Coeli Energy Transition under perioden 2019 - 2023.
- Ansvarig för energiinvesteringarna på Horizon Asset i London under 9 år, en marknadsneutral hedgefond.
- Erfarenhet från energiinvesteringar på MKM Longboat i London och aktieanalys inom teknologisektorn i Frankfurt och Oslo.
- MBA från IESE i Barcelona och Civilekonom från Norges Handelshögskola.
- Innan han började arbeta inom finans var han löjtnant i norska marinen.
IMPORTANT INFORMATION. This is a marketing communication.
Before making any final investment decisions, please refer to the prospectus of Coeli SICAV II, its Annual Report, and the KID of the relevant Sub-Fund. Relevant information documents are available in English at coeli.com. A summary of investor rights will be available at https://coeli.se/finansiell-och-legal-information/. Past performance is not a guarantee of future returns. The price of the investment may go up or down and an investor may not get back the amount originally invested. Please note that the management company of the fund may decide to terminate the arrangements made for the marketing of the fund in one or multiple jurisdictions in which there exists arrangements for marketing.