1) Share Class I SEK
Performance for other share classes towards the end of the report.
FUND MANAGER COMMENTARY
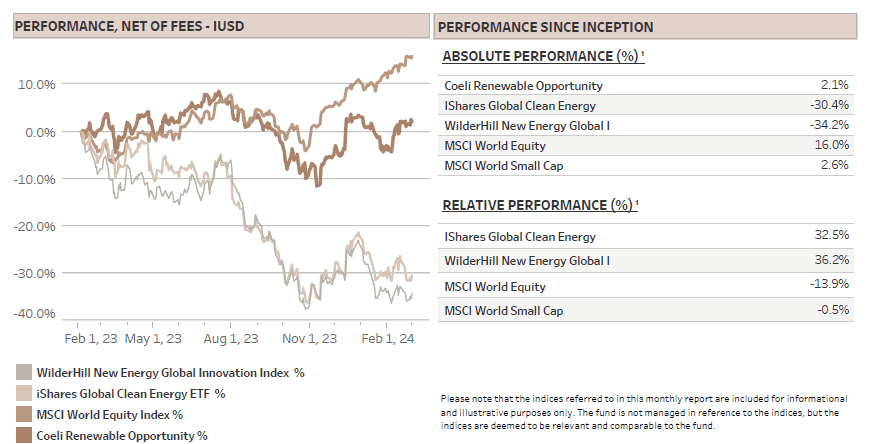
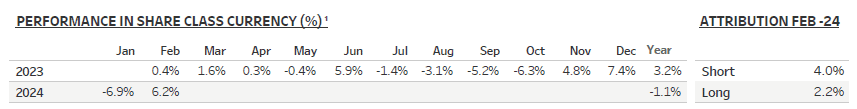
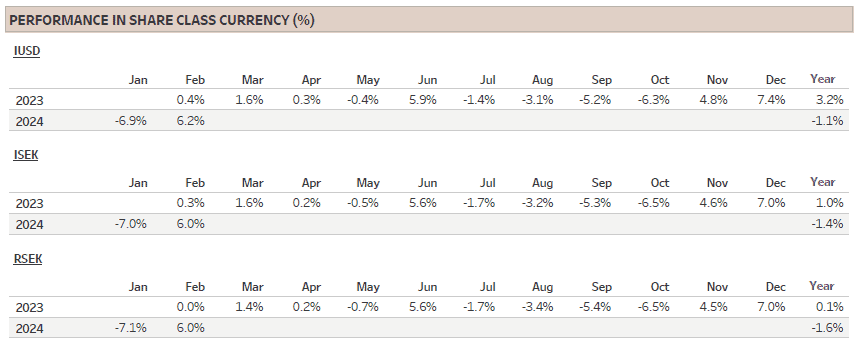
The Coeli Renewable Opportunities fund gained 6.2% net of fees and expenses in February (I USD share class). It is down 1.1% this year and up 2.1% since the inception on February 6, 2023.
The fund outperformed in February the two most comparable indices, the Wilderhill New Energy Global index (NEX) and the iShares Global Clean Energy (ICLN), by 6.5% and 5.5%, respectively, taking the year-to-date outperformance to 12.6% and 9.6%. Since inception, the fund is ahead by 36% and 33%, respectively.
Alpha generation since inception is strong at 11.0%, calculated using CAPM linear regression comparing to the average return of the two most comparable indices. The fund’s active returns have been solid with 12 out of 13 positive months on the short side and 7 positive months on the long side. Active returns are calculated by scaling up the long and short side respectively to 100% and comparing to the average return of the two indices. More on this in the fund performance part.
The fund delivered positive performance on both the long and short side in February, gaining 2.2% and 4.0%, respectively. The main reasons for the strong absolute and relative performance were good stock picking and positioning into earnings season. The hit ratio on long positions trading up post earnings and shorts going down was almost two-to-one versus losses on longs and shorts going higher. The stand-out name was Chart Industries (GTLS), our largest position, which added 13% on the earnings day. As expected, the company reduced 2024 EBITDA guidance slightly, but this was already in the price, and the stock is up 35% since the bottom in January.
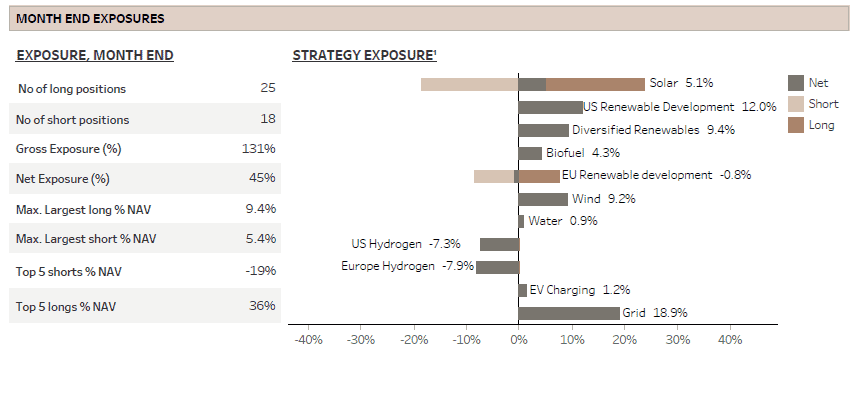
Moreover, in the “Grid” theme, containing only five longs, all companies reported solid Q4 results and rose by an average of 4% on the day of earnings. The companies also, as expected, guided to positive outlooks for 2024 and onwards. On the short side, the hydrogen companies are continuing to struggle to convince the market that they deserve elevated valuations as revenue forecasts are slashed on poor order intake. The two short themes added a combined 2.7% to NAV.
While gross exposure was only slightly reduced from about 135% to 131% into month end, we significantly reduced our net exposure from the high 50s percentage range to 45% at the close of the month. We mainly increased the short side of the book as some attractive opportunities emerged, but also reduced some longs as we will discuss in more depth in the fund performance part.
MARKET COMMENT – FOCUS SHIFTING TO ACTIVITY OVER INFLATION?
The S&P 500 continued its rally in February, setting eight all-time-highs records and closing the month with a 5.2% gain. Contrary to the narrow rally seen in January, February's gains were more broad- based with the S&P 500 equal weight index increasing by 4%. Nevertheless, the ‘Magnificent 7’ still account for about 45% of the year-to-date returns. Although the renewable indices were flat in February, the key small cap index, the Russel 2000, rose by 5.5% and is up on the year.
While FED chairman Powell stated in late January that a March rate cut was unlikely, the market priced out a May cut during February, and June is soon a coin-toss. From five expected cuts at the beginning of January, the bond market is currently only expecting slightly more than three. The main trigger for the change in expectation was of course the strong January inflation data, which combined with mostly strong economic activity numbers, helped cement the view that FED cannot only afford, but would be wise to wait with the first rate cut. As many pundits believe the January inflation numbers were distorted by seasonal effects, it is evident that the February data will be critically important in shaping future monetary policy expectations.
Nevertheless, whereas the November and December rally was fueled by expectations of rate cuts, the January and February rally was powered by a shift in focus from rates relief to better growth prospects. Earnings expectations for S&P 500 this year is up by almost 10% since early February and 2025 is up almost 15%. Of course, most of this is driven by the ‘Magnificent 7’, but the other 493 stocks are also seeing upgrades.
It is a shame that the renewable universe continues to lag the broad market, but we do believe there is light at the end of the tunnel. Earnings have or are about to bottom in many sub-sectors and as long as the rate cutting cycle commences sometime this year, without having been triggered by fears of a recession, which seems unlikely, we believe the prospects are increasingly improving.
HOW CAN YOU TELL IF A FUND IS GREEN?
This is a question with many different answers depending on who you ask. As our fund is focused on decarbonization, it is not a surprise that we believe the most important area to focus on is the energy transition. It is so important to us that we are co-operating with one of the leading Swedish universities to develop a methodology to measure the impact of avoided emissions, a relatively unexplored concept called Scope 4. More on that later.
Back to the initial question. Despite the significant increase in sustainability reporting requirements for funds, particularly in Europe, we doubt that it is much easier than in the past for investors to tell which investment funds are truly green and not. Funds are now classified into different articles: 6, 8, and 9 depending on how “sustainable” they claim to be. Although most funds truly try their best to make the planet a better place, some seem to use article 9 as a more sophisticated way to greenwash.
Let us quickly review the issue. To be an article 9 fund, the investments shall be sustainable first and performance focused second. And none of the investments should cause any harm. But what is sustainable? Apparently, most article 9 funds believe 20% or more of a company’s activities need to align to one of the 17 UN Sustainable Development Goals (SDGs). Although all of the 17 SDGs are important, most of them have nothing to do with fighting climate change and some are rather vague. Also, given the 20% limit, a ”sustainable” company could theoretically have up to 80% of its revenues from activities that are not at all linked to sustainable activities, but still qualify as an investment in an article 9 fund that achieves the highest level of sustainability ranking. These funds are often referred to as ‘dark green’ funds independently of which SDGs they are focused.
Talking our own book, our fund is an article 8 fund, which means that the primary goal is to make a profit for our investors while promoting environmental and social characteristics. However, despite the fact that all our long positions are involved in clean energy production, energy efficiency or decarbonization, we decided to classify the fund as an article 8 or ‘light green’.
Moreover, if we discuss what is commonly thought of as ”green” investments, i.e. investments that improve the environment and fight climate change, there are serious limitations with the current regulatory framework. In our view, this stems partly from the initial approach within the ESG community to exclude polluters or at least only invest in companies with low emissions based on so called scope 1, 2 and 3 emissions.
The focus on scope 1-3 emissions when it comes to climate and emissions reporting is often inadequate and sometimes directly misleading as a measure for green investments. Companies manufacturing solar panels, wind turbines, batteries, or even nuclear energy plants will inevitably have higher emissions in their operations than software companies, banks, or biotech firms. But does this operational footprint genuinely reflect their contribution, or lack thereof, fighting climate change?
This is where Scope 4 emissions become critically important as it attempts to assess the true climate impact of an investment. Scope 4 focuses on the emissions a company’s activities avoid rather than emit. For example, the manufacturing of a wind turbine involves significant emissions from producing steel, copper wires, and the foundation. However, once installed, the turbine generates clean electricity for about 30 years, essentially resulting in negative emissions over its lifetime. To illustrate this point, we have conducted our own comparison between Netflix and Vestas, demonstrating the difference in climate impact. Which stock is the greenest?
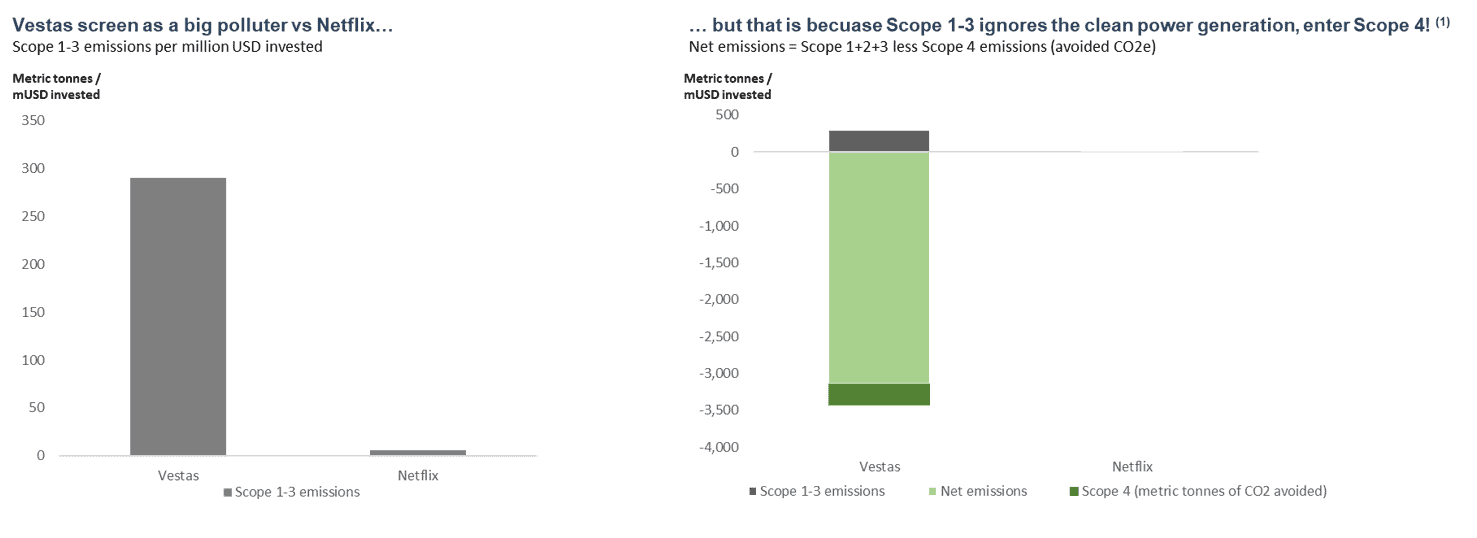
1) Avoided CO2/mUSD invested calculated as net of Scope 1-3 emissions and (capacity sold x baseline emissions x 20yr adjusted capacity factor x USD share of project (simple LCA using NREL estimates for onshore and offshore wind respectively) x 20yrs lifetime) / market cap
Admittedly, there are considerable challenges with measuring scope 4 emissions, but it does not add that much incremental complexity versus measuring scope 1-3. One major hurdle initially is that it is a relatively new concept, and the calculations lack an industry standard. However, we believe the basic concept is straightforward. For instance, OECD countries currently emit about 0.3kg of CO2 emissions per kWh of electricity production, so if a company can produce zero-emission electricity, that is the benchmark amount it avoids per kWh produced.
Nevertheless, Life Cycle Analysis and the allocation of emissions among different companies in the supply chain is one of the complicating factors. This is why we are collaborating with a Swedish university to develop a methodology that will look at the whole value chain. With this initiative we hope to scientifically explain why it is better for the climate to allocate capital to Vestas than to Netflix, which is currently not apparent when looking only at scope 1-3 emissions. This could be valuable for investors who are interested in environmentally positive allocations.
The gist is that if more investors would consider the potentially avoided emissions of their companies, more capital would be incentivized to support businesses that make a tangible difference rather than investing in companies that only have low emissions. Dark green is not always the greenest.
FUND PERFORMANCE – STRONG ALPHA GENERATION OF 11%
The fund gained 6.2% (I USD) in February, its second-best month to date with more than 70% of the themes making a profit and performance coming from both the long and the short side. As already mentioned, as the two most comparable indices, the Wilderhill New Energy Global index (NEX) and the iShares Global Clean Energy (ICLN), were flat on the month, we extended our outperformance. Since inception the relative outperformance increased to 32.5% and 36.2%, respectively.
Of course, comparing a long/short hedge fund with an average historical net exposure of 55% with indices that are 100% long-only gives a certain directional sense of the outperformance. We have therefore calculated the risk adjusted alpha generation since launch using the Capital Asset Pricing Model (CAPM) in a linear regression. We use the average return of the two comparable indices as the input for market return, the US 3-month as risk free return and by running the regression over the daily data since launch, the regression finds two variables, the beta and the alpha. The model, with all its flaws, gives a result of a beta of 0.54 and alpha of 11%.
We have also calculated the active returns of the long and short side separately on a monthly basis. This calculation scales up the long and the short positions to 100% and compares to the average return of the two above mentioned indices. We are pleased although not surprised that our short book has outperformed the indices in 12 out of 13 months. We are also satisfied that the long positions have outperformed in 7 out of 13 months as we have sometimes carried longs that have worked as hedges against large short positions in the short book.

The "Grid" theme emerged as the top performer in February, contributing a 1.9% increase to the Net Asset Value (NAV). Its five members are all in one way or another involved in the build out of the distribution and transmission grid, an activity that is only increasing in importance with accelerating electrification and an increasing share of renewable energy added to the grid. The average order backlog for the five companies is up 180% in the last two years alone and we believe 2024 will be another strong year for the group.
The second-best performing theme was “European Hydrogen”, which contributed 1.9% to NAV. The theme consists of short positions in European based hydrogen companies which as a group are continuing to disappoint on order intake and therefore revenue visibility. The biggest input factor by far in the production of green hydrogen is electricity. Three-four years ago, there was a hope that it would be possible to produce renewable energy at such a low price that limited subsidies would be required to make green hydrogen competitive with grey hydrogen derived from natural gas. However, this has not played out, at least not yet, and it is increasingly obvious that it will be more cost efficient, and better for the climate in most cases, to use green electricity directly instead of taking the inefficient route around hydrogen. Also, to qualify for subsidies, requirements to clean energy used in hydrogen production have become stricter than expected in both the US and the EU. This has caused many developers to postpone projects at best, and at worst cancel. We continue to be skeptical to this space.
The third-best performer was the “Diversified Renewables” theme increasing the NAV by 1.7%. It contains only one long position, Chart Industries (GTLS), which we have written about in many previous monthly reports. In January the stock sold off triggered by concerns over the Biden administrations’ possible moratorium on LNG export licenses. As we clarified in our last update, even in the event of an outright ban, which seems improbable, GTLS’s business will not be impacted for the next 3-4 years. The other fear in the market is that the company is too levered after the Howden acquisition. However, the company showed improved cash flow generation in Q4 and reaffirmed the free cash flow guidance for 2024. The stock is trading in line with its historical valuation, but as the Howden acquisition added significantly more service revenues and a broader industry footprint, we believe the stock should eventually trade closer to industrial peers with a more than 50% higher valuation multiple.
The worst performing theme of the month was “US Renewable Development”, losing 0.9% of NAV. This despite decent Q4 results from both of our two long positions Nextera Energy (NEE) and AES. However, we believe both are extremely well positioned to benefit from AI data center demand for renewables and we are likely to expand this theme with more companies going forward.
The last theme worth mentioning is the “Solar” theme which only added 0.2% to NAV. We came into the year optimistic to utility scale solar growth for 2024 and expected our holding in Array Technologies (ARRY) to both benefit and rerate from the seemingly depressed valuation level. We may be right on the solar market, but we were flatly wrong on ARRY, at least in the near term. There has seldom been such a wide discrepancy between what we hear from management on their market position and what seems to be happening in the market space. We cannot get to another conclusion than ARRY is losing significant market share, not only to its largest public competitor NEXTracker (NXT) but also to private companies and foreign new entries in the US market. ARRY gained significant market share in 2022 only to lose it in 2023-2024. This may change in 2025, given the phasing and long duration of utility scale solar projects, but we believe now is not the time to own the stock. We took advantage of the positive share price reaction around earnings to exit the position.
The utility scale market growth in 2024 is likely to be slower than we expected only some months ago, but this is not due to demand, but rather due to project postponements following permit and interconnection delays, and customers awaiting final IRA guidelines. However, we believe these problems are solvable as utility scale solar is still the cheapest form of energy in the US and in most of the world. With accelerated electrification of industry and transportation including the rapid growth in AI data centers, cheap energy will surely be in demand.
Sincerely
Vidar Kalvoy & Joel Etzler
- Portföljförvaltare och grundare av fonden Coeli Energy Opportunities.
- Mer än 15 års erfarenhet av investeringar från både publika och private equity-sidan.
- Förvaltade fonden Coeli Energy Transition under perioden 2019 - 2023.
- Spenderade sex år på Horizon Asset i London, en marknadsneutral hedgefond.
- Började arbeta tillsammans med Vidar Kalvoy 2012.
- Fem år inom Private Equity på Morgan Stanley.
- Startade sin investeringskarriär inom tekniksektorn på Sweden Robur i Stockholm 2006.
- Utbildad Civilingenjör från Kungliga Tekniska Högskolan.
- Portföljförvaltare och grundare av Coeli Energy Opportunities-fonden.
- Förvaltat aktier inom energisektorn sedan 2006 och har mer än 20 års erfarenhet från portföljförvaltning och aktieanalys.
- Förvaltade fonden Coeli Energy Transition under perioden 2019 - 2023.
- Ansvarig för energiinvesteringarna på Horizon Asset i London under 9 år, en marknadsneutral hedgefond.
- Erfarenhet från energiinvesteringar på MKM Longboat i London och aktieanalys inom teknologisektorn i Frankfurt och Oslo.
- MBA från IESE i Barcelona och Civilekonom från Norges Handelshögskola.
- Innan han började arbeta inom finans var han löjtnant i norska marinen.
VIKTIG INFORMATION. Denna information är avsedd som marknadsföring. Fondens prospekt, faktablad och årsberättelse finns att tillgå på coeli.se och rekommenderas att läsas innan beslut att investera i den aktuella fonden. Prospektet och årsberättelsen finns på engelska och fondens faktablad finns bland annat på svenska och engelska. En sammanfattning av dina rättigheter som investerare i fonden finns tillgängligt på https://coeli.se/finansiell-och-legal-information/.
Historisk avkastning är ingen garanti för framtida avkastning. En investering i fonder kan både öka och minska i värde. Det är inte säkert att du får tillbaka det investerade kapitalet.