1) Share Class I SEK
Performance for other share classes towards the end of the report.
FUND MANAGER COMMENTARY
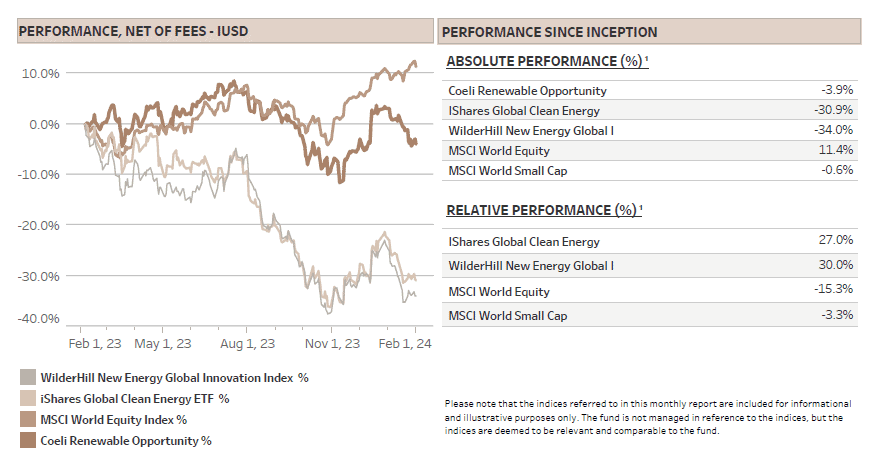
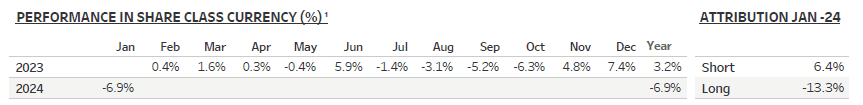
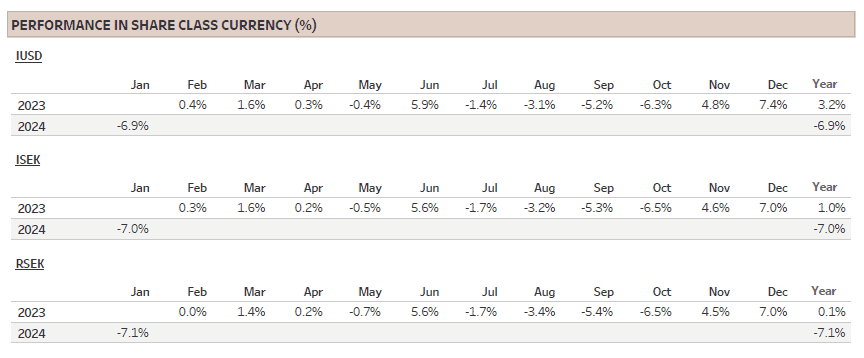
The Coeli Renewable Opportunity fund lost 6.9% net of fees and expenses in January (I USD share class). It is down 3.9% since the inception on February 6, 2023.
Despite the weak start to the year, the fund outperformed the two most comparable indices, the Wilderhill New Energy Global index (NEX) and the iShares Global Clean Energy (ICLN) by 6.5% and 4.4% in January. Since inception, the outperformance is 30% and 27%, respectively.
There were several reasons for the poor performance of the renewable energy equities in January. First, the sector had a great run in November and December and was due some profit-taking. Second, a key driver for the yearend rally was the sharp fall in long term rates triggered by expectations of a FED cut in March followed by four to five more reductions the next 12 months. However, long term rates rose in early January as optimism on cuts was wound back and renewable energy duly underperformed. Finally, Europe’s fossil-linked power prices, which had been declining through November and December, took another leg down in January. This can be explained by the warm winter, the seasonally full gas storage and the lack of industrial demand pick up in Europe and China. However, we were surprised that forward price for 2025 and 2026 decreased even more than 2024 prices, suggesting underlying dynamics that warrant a more in-depth analysis.
Moreover, while we expected some earnings downgrades for the developers from unhedged merchant power prices, we were taken aback by the profit warning from RWE. Earnings impact on flexible generation were clearly more impacted than we and the market had anticipated. With a strong readthrough to RWE’s peers, our two renewable development themes were among the worst performers in January.
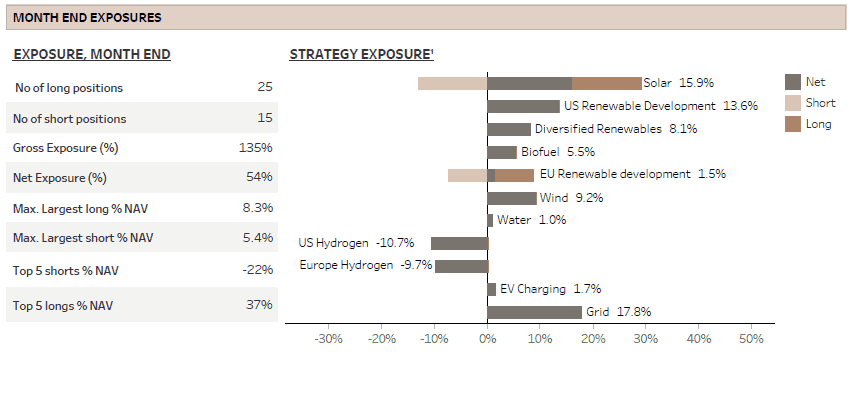
Long positions lost 13.3% of NAV in January, but the overall pain was eased by shorts gaining 6.4%. We reduced net exposure to 54% at the month-end as we became increasingly concerned about forward power prices and acknowledged the less optimistic expectations for FED cuts. The fund has a variable net exposure but operate with a sweet spot in the 40-80% range.
MARKET COMMENT – FROM SOFT LANDING TO NO LANDING?
Despite the reduced optimism on an early FED cut, the S&P 500 rose by 1.6% in January and set a new all-time high. The rally was narrow though and mainly driven by Megacap and other technology companies while the equal weighted S&P was down 1%. The Russel 2000 Index, representing small caps, fell by 4% and the key renewable energy indices did even worse ranging from a decline of 11% to 21%, proving their higher interest rate sensitivity.
The month ended with a FED meeting where Chairman Powell stated that a March rate cut was unlikely. Following strong job data in early February, the bond market has practically removed the chance of a March cut and see only a 60% chance of a rate reduction in May. The market is at the time of writing expecting four cuts this year versus five at the beginning of January.
The economic activity is simply better than most pundits had expected, and the talk has again changed from ‘soft vs hard landing’ to ‘soft landing vs no landing’. This means the FED has more time to gauge that inflation is really coming down to target and it can reduce the risk of a too early cut triggering a re-acceleration of inflation. On the other hand, an interesting recent development was Governor Bostic confirming the FEDs new view of the NAIRU (Non-accelerating inflation rate of unemployment) to be significantly lower than in the past. This implies that the unemployment rate does not need to rise materially from the current level to support the probability of rate cuts.
Although the deferred interest rate reductions hurt share prices in our universe in the short term, we would rather see delayed rate cuts and no economic slowdown than rapid cuts due to a recession. In the end, as long as the cutting cycle commences this year and inflation gets close to the 2% target, we continue to believe that renewable energy equities will do well in 2024.
THE UNEXPECTED DOWNWAD TREND IN EUROPEAN POWER PRICES
In 2022 when Russia attacked Ukraine, the global economy was shaken by a severe power price shock as energy costs soared to a staggering 12% of global GDP. In the wake of diminished gas supplies from Russia, the crisis set the stage for an ongoing debate about the future of energy prices, particularly in Europe. As Europe secured its own energy supply by bidding up the global price of LNG (Liquefied Natural Gas), it left emerging markets in a difficult position.
These countries, led by China, India and Indonesia responded in a natural yet impactful way by substantially increasing coal production. This move reversed the prior trend of stable to declining global coal demand. The International Energy Agency's (IEA) 2018 prediction of 7.6Gtpa global coal demand for 2023 fell short, as the actual figure is almost 15% higher. This surge resulted in an additional 2 billion tons of annual Green House Gas emissions, more than a 3% increase on the total annual emissions, a dire outcome for the climate.
The increased coal production in Asia is clearly one of many reasons for the sharp drop in forward power prices in Europe and Germany over the last months, which accelerated in January. This development warrants a deeper analysis.
Since mid-October, the German baseload electricity price 12- and 24-months forward are both down more than 35%, with about 70% of the decline in January. Although this is great news for European industry and the global fight against inflation, it could have a negative impact on certain subsector in the renewable energy space. An emerging worry in the financial markets is that the lower power prices will impact Power Purchase Agreement (PPA) prices as they are in effect long term contracts to purchase power.
But first, why are power prices falling? Power prices in Europe are largely a function of gas price and carbon prices, but as the latter tend to follow the gas price on the way down, the culprit is mainly the gas price. Why are both the spot and the 12-month forward gas price down by almost 50% and 24-month forward about 30% lower than in mid-October?
On the demand side, the mild winter plays a significant role combined with reduced European industrial demand, which is still lagging 15-20% below pre-energy crisis levels. Last years’ high residential energy bills also appear to have had an impact on consumer habits as demand is down more than what can be explained by the temperature. According to EMBER, an energy think tank, weather adjusted power demand in the EU 27 is down as much as 7% since 2021.
On the supply side, as described above, there has been a global increase in coal consumption facilitating the higher imports of LNG to Europe. There is also more piped gas from Norway and North Africa, while demand for gas for power production is reduced as supply of nuclear and hydro energy is up significantly since 2021/22. In addition, solar and wind capacity is added every year helping to reduce the need to burn gas for power. In total, gas demand for power production was 17% lower in H2/23 than in H2/22, according to EMBER. This is good news for Europe’s carbon footprint.
However, considering this supply/demand situation and the fact that European gas inventories were at full capacity last autumn, it is not surprising that inventories in early February is almost 70% full vs historical average in the low to mid 50% range. Moreover, assuming normal temperatures over the next months, there is a significant risk of tank tops, i.e. full storage, during the summer. In the few instances this has happened in the past, the price can briefly trade below EUR 10MWh versus almost EUR 30MWh today. Power prices correlates strongly with gas prices on the way down, so this would be a headwind for companies with limited fixed price contracts or hedges.
The above scenario is something we have been aware of for several quarters, but what has taken us by surprise is the even sharper fall in the forward power prices. The market seems to be willing to price in not only a mild winter next year, but also no significant improvement in demand for power. Demand is fundamentally difficult to forecast as it is driven by many factors, including the price level.
Although the supply side is also complicated, it seems likely that the global LNG markets will be well supplied the next three to four years. The two largest LNG exporters, the US and Qatar, are ramping their export capacity by 100% and 50%, respectively over the next years, see below.
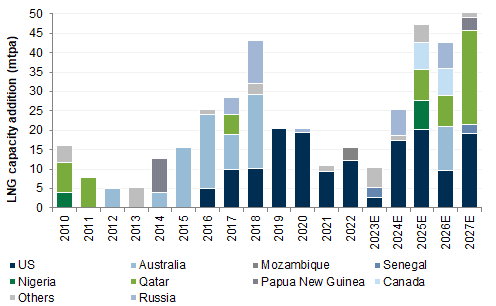
Source: Goldman Sachs
The new LNG export capacity is in fact larger in size than the Russian piped gas that has been shut in. The Russian gas accounted for about 40% of Europe’s gas consumption before the war. Since European power prices are almost back to pre-war levels, the Russian gas has basically been replaced by alternative energy sources; LNG, piped gas, coal burning in Asia, new renewable energy and importantly, reduced demand from industry and households in Europe and Asia.
At first glance, it looks like we are set up for oversupply and low gas and power prices for years to come. However, it is important to have in mind that as gas prices fall, coal to gas switching will occur. Also, when power prices decline, demand will surely pick up helping to balance the market. As always in commodity markets, low prices alleviate low prices, just like the high prices of the energy crisis was cured by triggering more supply and reducing demand.
What is the impact on the PPA prices and the implication for renewable developers? PPA prices have a floor which is roughly the price at which developers make a return. This threshold is driven by capex, cost of financing and cost of capital. The PPA cannot be set below the floor as the developer would be destroying value. However, PPAs above the threshold are correlating with power prices as developers will try to maximize returns, taking advantage of arbitrage between market prices and PPA prices. On the margin, lower and most importantly declining PPA prices have, everything else equal, a negative impact on the developers. This was rapidly priced into the share prices in January, though.
Nevertheless, there are additional factors to consider. First, input costs for solar panels have halved in Europe and there is potential for lower financing costs in the near future. This could lead to attractive returns even at reduced PPA prices. Second, most renewable development projects take years from planning starts to production commences. This means basing investments decisions on volatile forward prices might be unwise unless you can lock in these prices, which is difficult for large buyers in need of 15-20 years agreements. Third, there has been and still is a large group of price agnostic buyers willing to purchase PPAs at rates well above spot and forward power prices. This segment is likely expanding, with a notable example being the owners of generative AI server farms. These servers consume approximately 4 to 20 times more electricity than traditional cloud servers, and demand forecasts keep being revised higher at a very rapid pace. Finally, if PPA prices fall to levels that are not economically viable, governmental intervention may become necessary to achieve specific climate goals. This approach has been and continues to be a key factor in the development of for example offshore wind projects.
All in all, although we and the market were taken by surprise by the sharp fall in power prices in January, we believe this development creates interesting opportunities on both the long and short side and we see several interesting ways to profit.
FUND PERFORMANCE – CHALLENGING MONTH IN RENEWABLES
The fund lost 6.9% (I USD) in January, its worst month to date as all but the two hydrogen themes and the ‘Grid’ theme were down on the month. As already mentioned, the renewable indices fell by 11% to 21% in January, driven down by a reversal in rate expectations and profit taking after a strong performance during the last two months of 2023.
The renewable energy developers in Europe were also hit by lower power prices. The ‘EU Renewable development’ theme lost 1.6% of NAV, pulled down by RWE and EDPR which declined by 17% and 19%, respectively. The stocks were already significantly down when RWE towards the end of the month warned that 2024 profit was likely to come in at the low end of the guidance range it published only two months earlier. Although it was widely expected that the decline in power prices would hurt earnings on unhedged renewable energy production (the consensus for RWE was a 4-5% hit to 2024 earnings per EUR 10MWh decline in power prices), the profit warning indicates that the impact on flexible generation, i.e. electricity generation from gas, coal, hydro and biomass, will be much more substantial than the hit to unhedged renewable power sales. This surprised us, most analysts and judging from the share price reaction, many on the buy-side.
Although we believe RWE’s management is prudent in its guidance, we have reduced the net exposure to renewable developers by both cutting long positions and adding shorts that will be hurt even more than RWE if power prices should test new lows this year.
The worst performing theme of the month, losing 3.1% of NAV, was not unexpectedly the ‘Solar’ theme. It has the largest gross capital allocation, and it is still skewed net long, though less than in the past. The TAN Index, the Invesco Solar ETF, declined as much as 21% during January on no specific industry news. As the index has almost unwound all the gains from November and December (+27%), we believe sentiment and positioning are again the main drivers, but closing in on October lows, the sector could be about to bottom.
At least there were some positive news on the last day of the month. Nextracker (NXT), the global leader in solar tracking systems, reported very strong quarterly results and increased the guidance for the third quarter in a row. NXT presented an optimistic view to the market and quoted an industry growth expectation of 26% annually over the next 5 years. Sell-side consensus agreed and is currently expecting almost 50% higher revenues for NXT in FY 2027 than in FY 2024. Although it is obvious that NXT is winning significant share from among others Array Technologies (ARRY), a company that we own, it is unreasonable to assume that NXT’s strong growth is solely from market share gains. We believe the growth in the utility-scale market is likely to surpass the current consensus, which expects only high single-digit increases. Satellite tracking sources point to a potential of 70% growth in 2024. Although many of these projects have already sourced trackers sold by NXT and ARRY, we believe it implies upside to current consensus.
Although we admit having bet on the wrong utility scale company, at least so far, we believe there is upside in the ARRY stock as the market is expecting earnings to come in well below the sell-side consensus. The company also has substantial orders pending the clarification of the IRA’s domestic content rules, and it is screens inexpensive on 2025 earnings expectations. Finally, the stock has given up all the gains from November and December and is again heavily shorted, which we believe could trigger a rally even on mediocre quarterly results.
At least that is what happened to Enphase (ENPH) in the first week of February. The stock rose 17% after reporting weaker than expected Q4 results combined with lowered Q1 guidance and a delayed normalization in revenues. Although short interest was large heading into earnings, the management team also talked convincingly about the residential market bottoming in both the US and Europe one of the next quarters. As most pundits know, it is often late to buy these stocks after earnings have bottomed.
The third worst performing theme was ‘Diversified Renewables’ which deducted 1.4% from NAV. This theme only contains one long position, Chart Industries (GTLS), which is one of our largest positions and we have written extensively about it in several previous monthly reports. The stock fell almost 15% in January, virtually all of it in the last week as news broke that the Biden administration would put a moratorium on further LNG export licenses from the US. As usual, the market shoots first and ask questions later.
First, LNG is an important business line for Chart, so the headline reads bad. However, the moratorium only applies to new projects. i.e. already permitted projects are allowed to continue. The pipeline of LNG projects we showed earlier in the report is thus safe. Second, Chart put out a press release reiterating its medium-term financial targets through 2026 and stating that it had not included any Big LNG projects in these targets.
Third, the moratorium is conveniently expected to last until after the election in November proving ample time to assess the claim that the carbon footprint of LNG is in fact higher than coal. If this is really the case, we would strongly support halting all new LNG export projects. However, if the assertion is not confirmed, we expect the moratorium to be lifted even if Biden wins a second term. If Donald Trump should win the election, we suspect export licenses would be granted even if the carbon footprint is as high as asserted by some environmentalists. Finally, Chart is a global supplier of LNG equipment and if there is a ban on further LNG export terminals in the US, there will be other regions of the world willing to provide LNG, granted that the economic prospects are sufficiently attractive. We believe that could maybe be a more important hurdle.
Chart is reporting Q4 earnings at the end of this month. The expectation is that it will lower its 2024 EBITDA target, which is already reflected in consensus that is 15% below. Our focus will be on free cash flow generation, and we expect fewer one-off adjustments as the Howden integration should have moved to a new level.
The only two themes with significant positive contribution in January was ‘US Hydrogen’, which added 1.8% to the NAV, and ‘EU Hydrogen’ which contributed 0.6% despite a short squeeze of more than 30% in one of our short positions. This stock has already given up all its gains and then some this month, though. We continue to be skeptical to the long-term demand outlook for hydrogen and our view is supported by the dearth of large orders the last 2-3 quarters.
Sincerely
Vidar Kalvoy & Joel Etzler
- Portföljförvaltare och grundare av fonden Coeli Energy Opportunities.
- Mer än 15 års erfarenhet av investeringar från både publika och private equity-sidan.
- Förvaltade fonden Coeli Energy Transition under perioden 2019 - 2023.
- Spenderade sex år på Horizon Asset i London, en marknadsneutral hedgefond.
- Började arbeta tillsammans med Vidar Kalvoy 2012.
- Fem år inom Private Equity på Morgan Stanley.
- Startade sin investeringskarriär inom tekniksektorn på Sweden Robur i Stockholm 2006.
- Utbildad Civilingenjör från Kungliga Tekniska Högskolan.
- Portföljförvaltare och grundare av Coeli Energy Opportunities-fonden.
- Förvaltat aktier inom energisektorn sedan 2006 och har mer än 20 års erfarenhet från portföljförvaltning och aktieanalys.
- Förvaltade fonden Coeli Energy Transition under perioden 2019 - 2023.
- Ansvarig för energiinvesteringarna på Horizon Asset i London under 9 år, en marknadsneutral hedgefond.
- Erfarenhet från energiinvesteringar på MKM Longboat i London och aktieanalys inom teknologisektorn i Frankfurt och Oslo.
- MBA från IESE i Barcelona och Civilekonom från Norges Handelshögskola.
- Innan han började arbeta inom finans var han löjtnant i norska marinen.
VIKTIG INFORMATION. Denna information är avsedd som marknadsföring. Fondens prospekt, faktablad och årsberättelse finns att tillgå på coeli.se och rekommenderas att läsas innan beslut att investera i den aktuella fonden. Prospektet och årsberättelsen finns på engelska och fondens faktablad finns bland annat på svenska och engelska. En sammanfattning av dina rättigheter som investerare i fonden finns tillgängligt på https://coeli.se/finansiell-och-legal-information/.
Historisk avkastning är ingen garanti för framtida avkastning. En investering i fonder kan både öka och minska i värde. Det är inte säkert att du får tillbaka det investerade kapitalet.